Historian, a tool that allows you to analyze data without special skills
Aska Company utilizes a tool called "Historian." "Historian" is an externally produced tool. Aska company has the advantage of in-house production of systems such as CiS and MiS. CiS is a software that manages and analyzes camera inspection data, and MiS is a software that manages and visualizes various molding machine data. We are also working to introduce external systems. That is one of our strengths. The System Department operates the above software because it is a system that requires servers and networks. However, changing a part of these systems requires communication with the System Department each time. That is not suited for attaching and removing various sensors and tools in a short period on the manufacturing side. We adopted this Historian because it makes that part of the process very easy. The manufacturer provided us with a lot of explanations before introducing the system. Thank you very much.
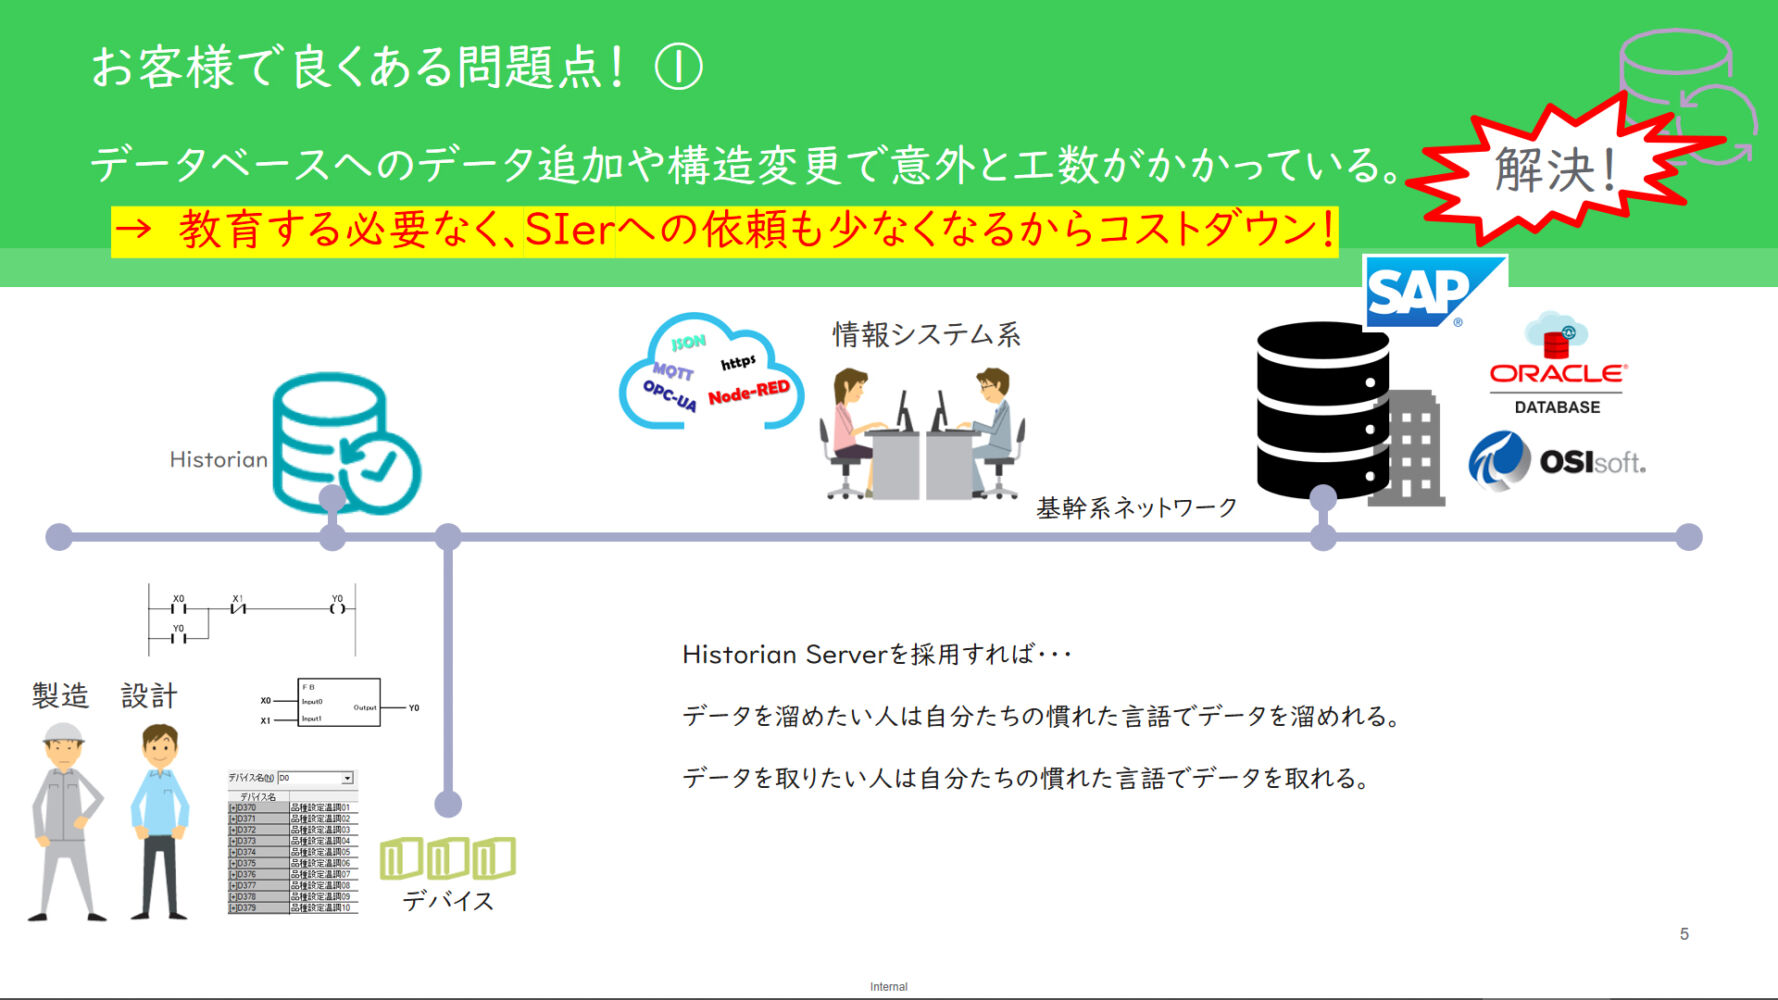
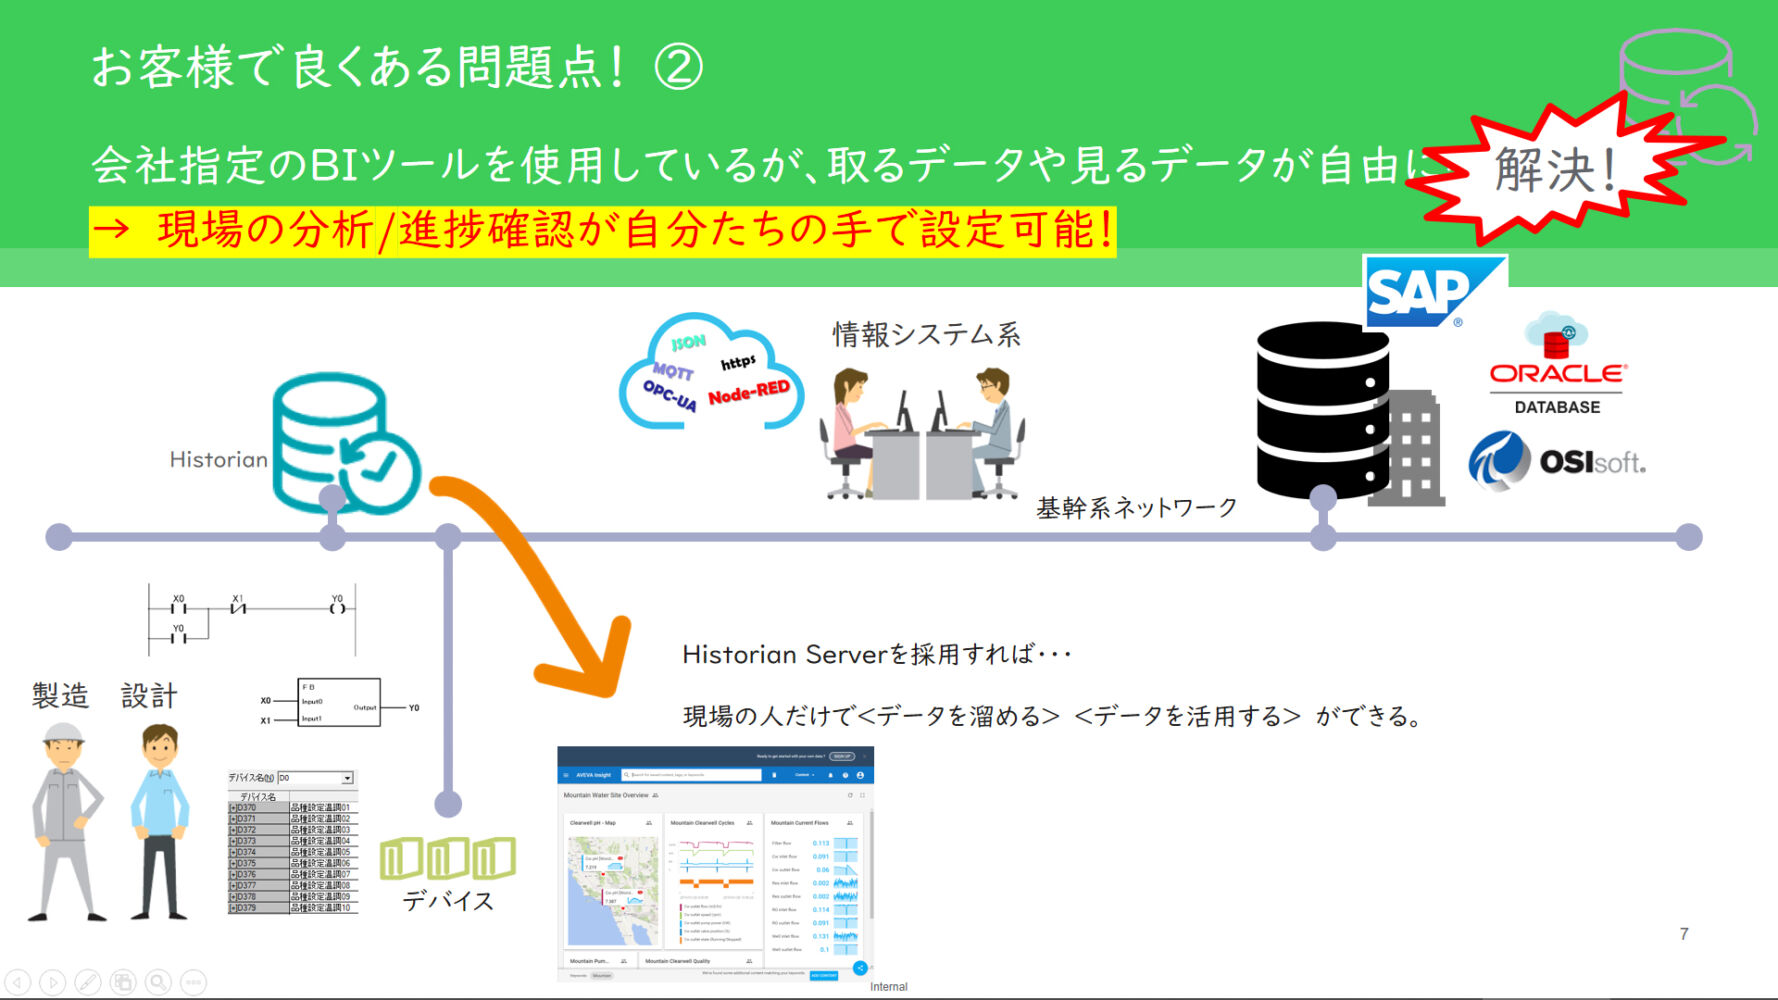
※From the material used in the Historian's explanation.
What I like about "Historian"
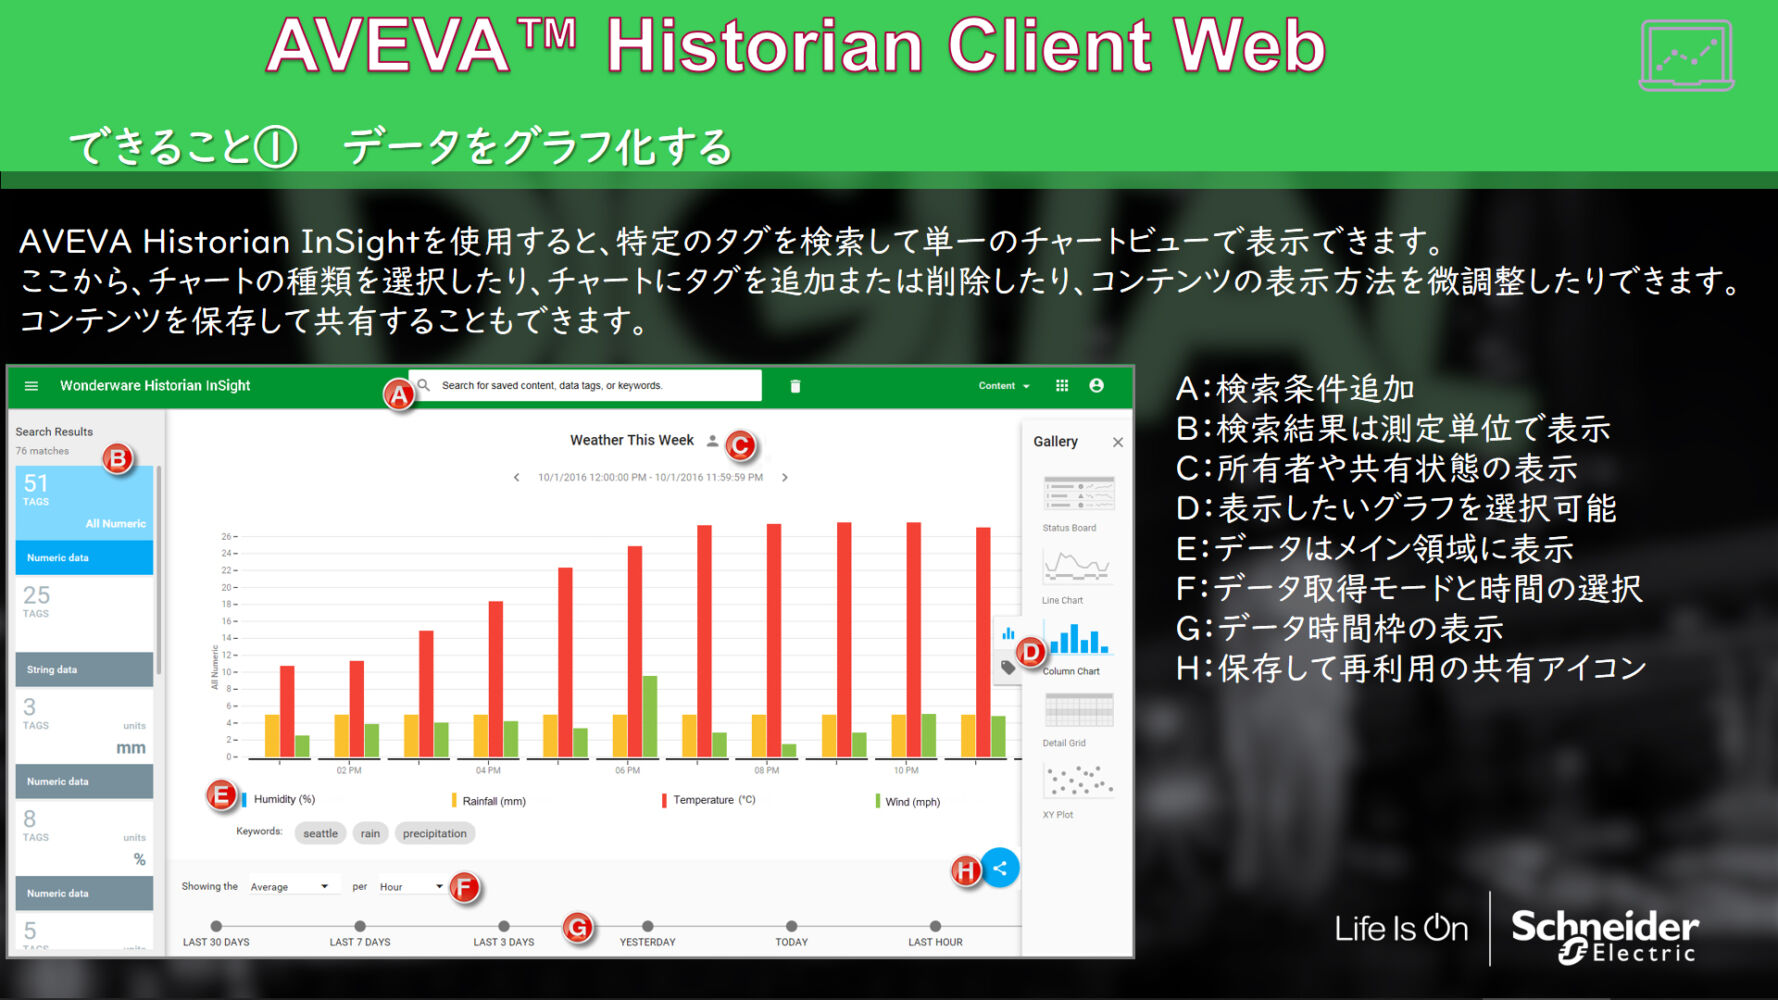
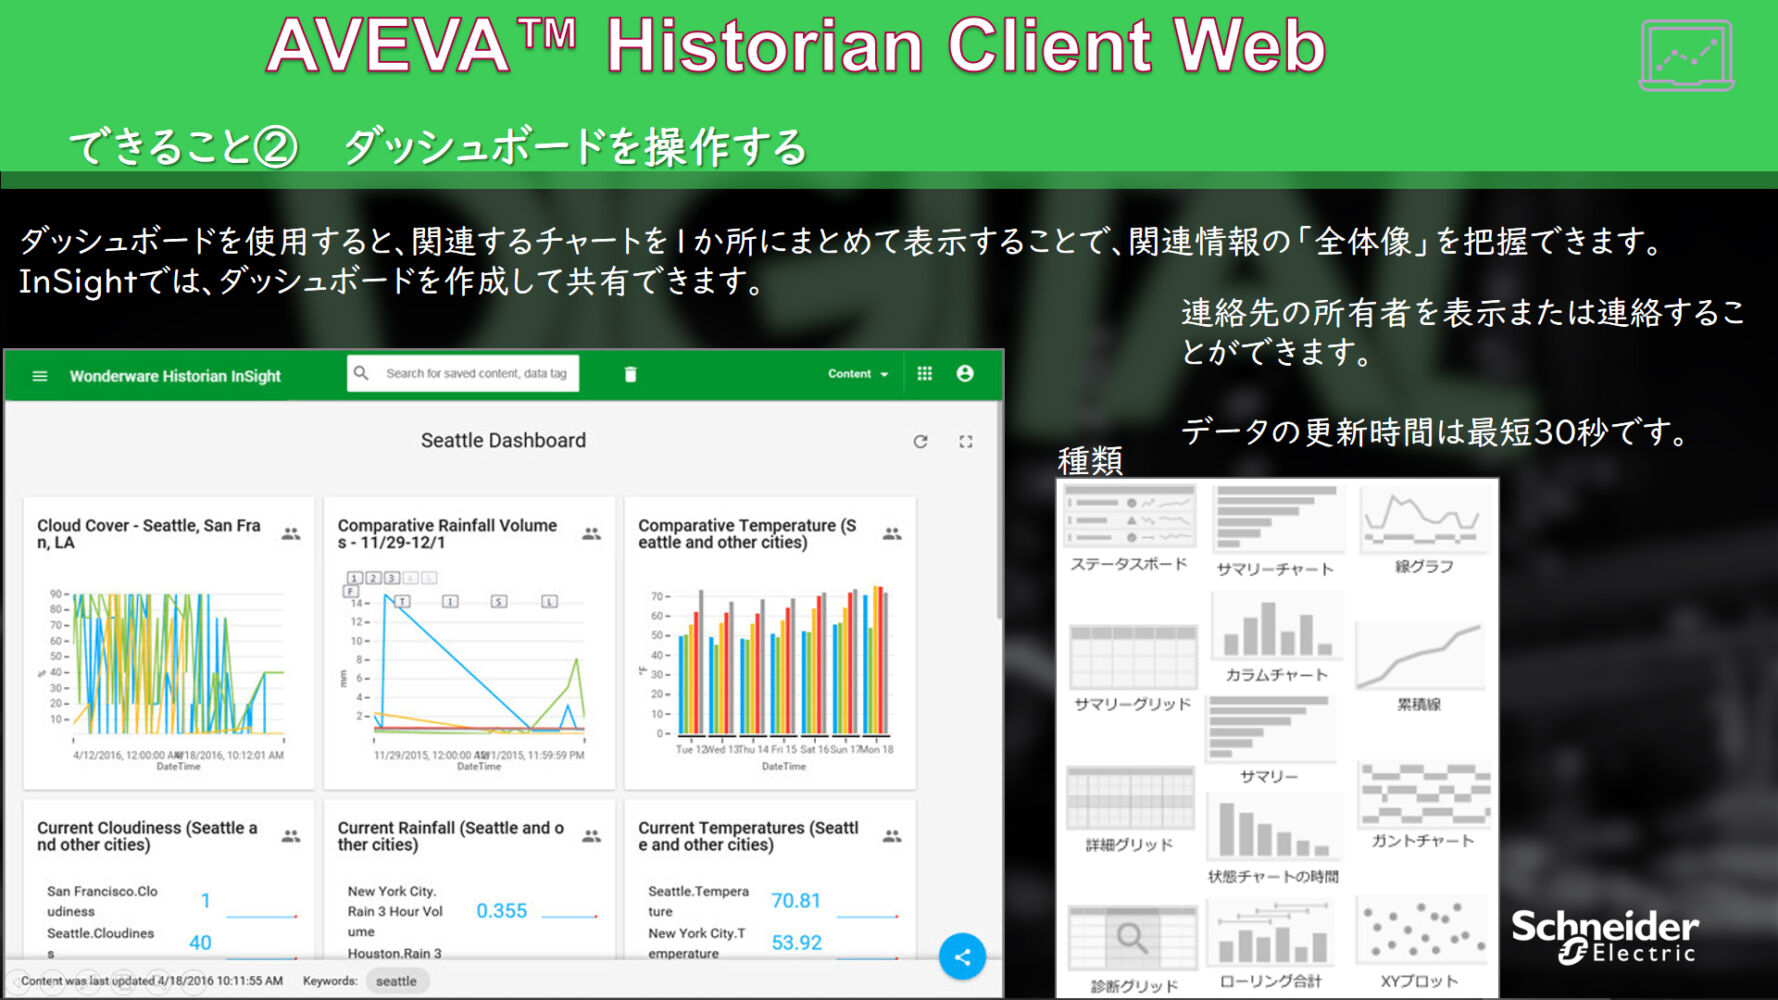
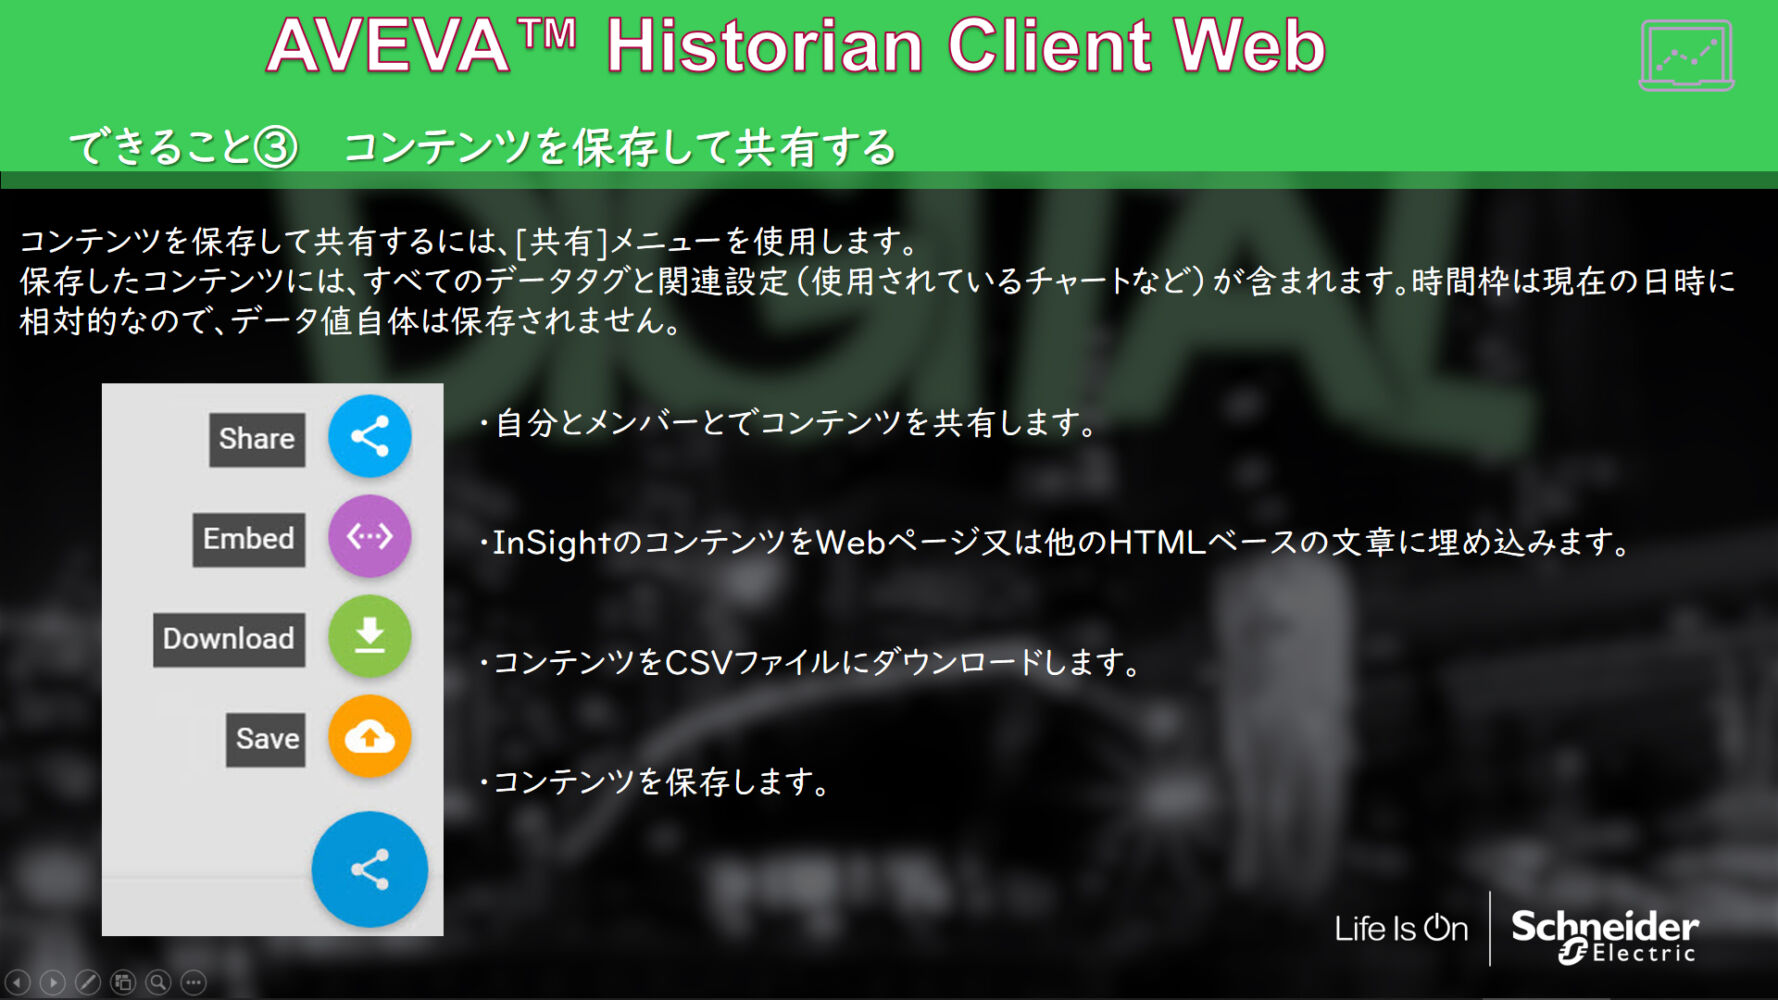
It took us a little time to master it, but we can use my time meaningfully after we get to know how to use it. We used to spend a lot of time manually and carefully "collecting data," "summarizing (graphing) data in Excel," and "analyzing data" to talk with data. However, now we no longer have time to edit data. The system has all the necessary functions, such as a dashboard creation function for centralized management, content sharing, and downloading to CSV, and we can use it for various purposes.
※Historianの説明で使用された資料より
From the material used in the Historian's explanation.
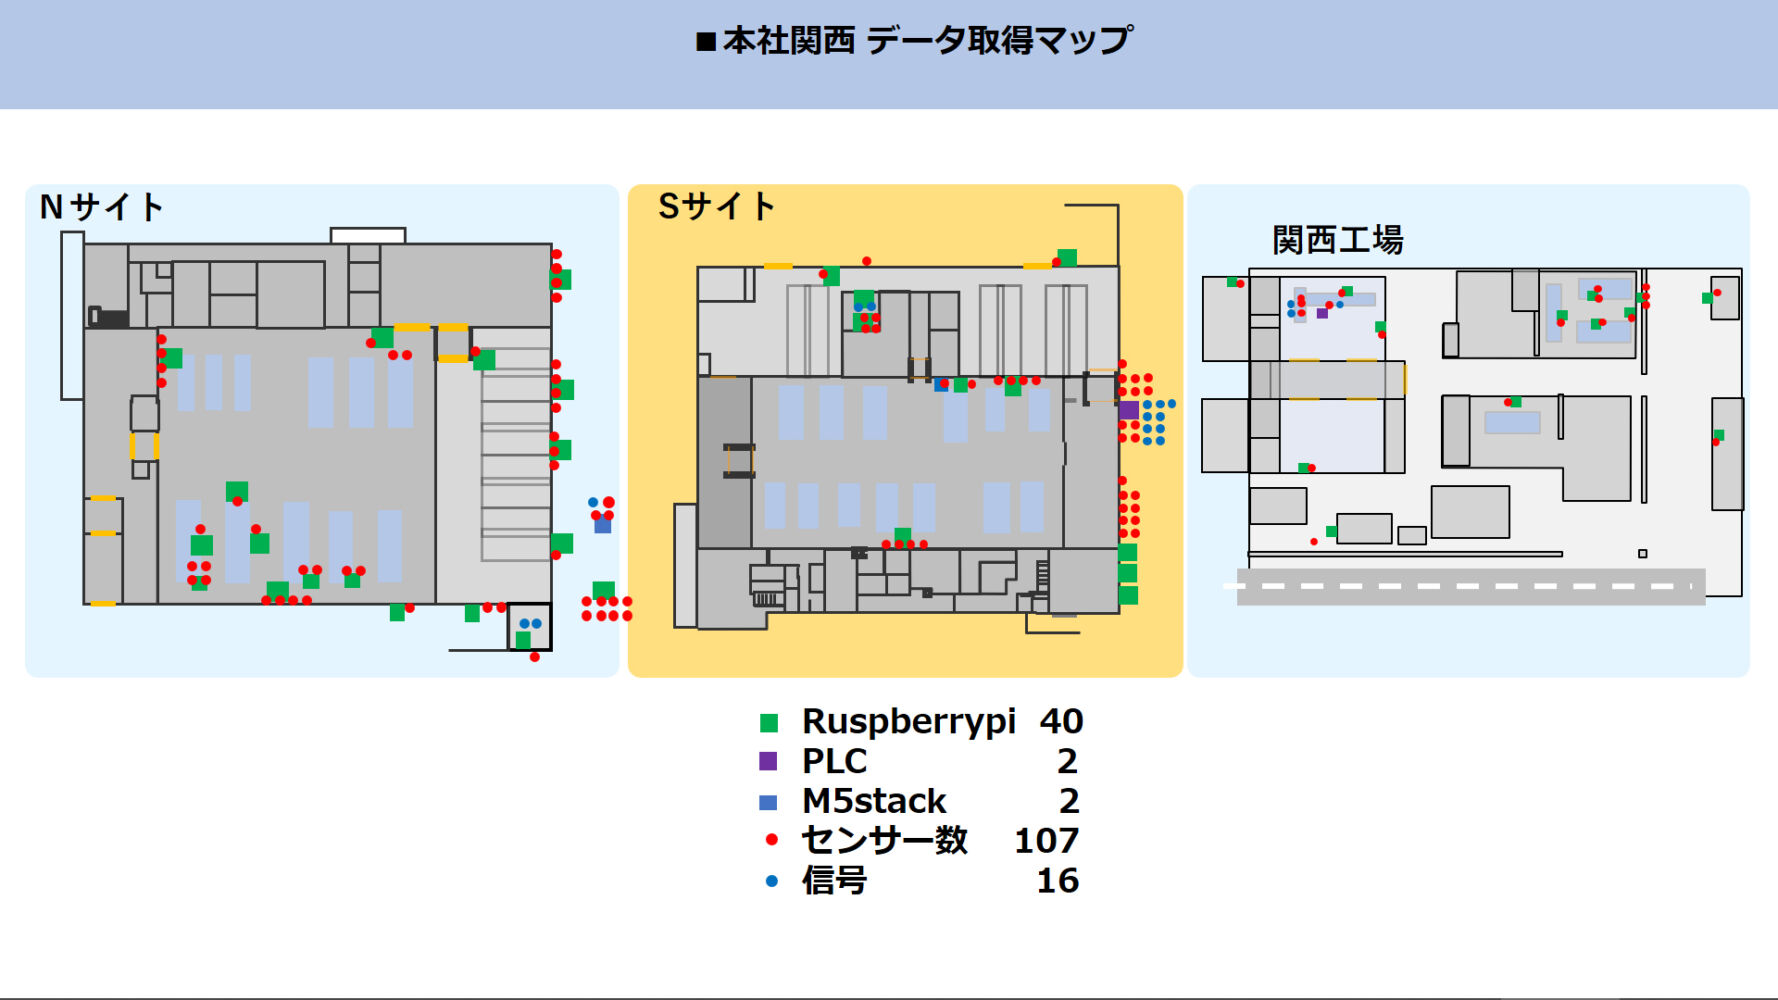
With Historian, we no longer need to coordinate with the system department for devices managed on the manufacturing side, which we had to do every time we installed a device. Now that we can easily do the things we have wanted to try. It has become easier to install sensors and devices as needed. As a result, as of April 2022, the number of sensors in the manufacturing area in the head office and Kansai Plant was 107 devices, and the total number of other devices was nearly 170 and has continued to increase since then.
How to use the data
① HVAC monitoring and management
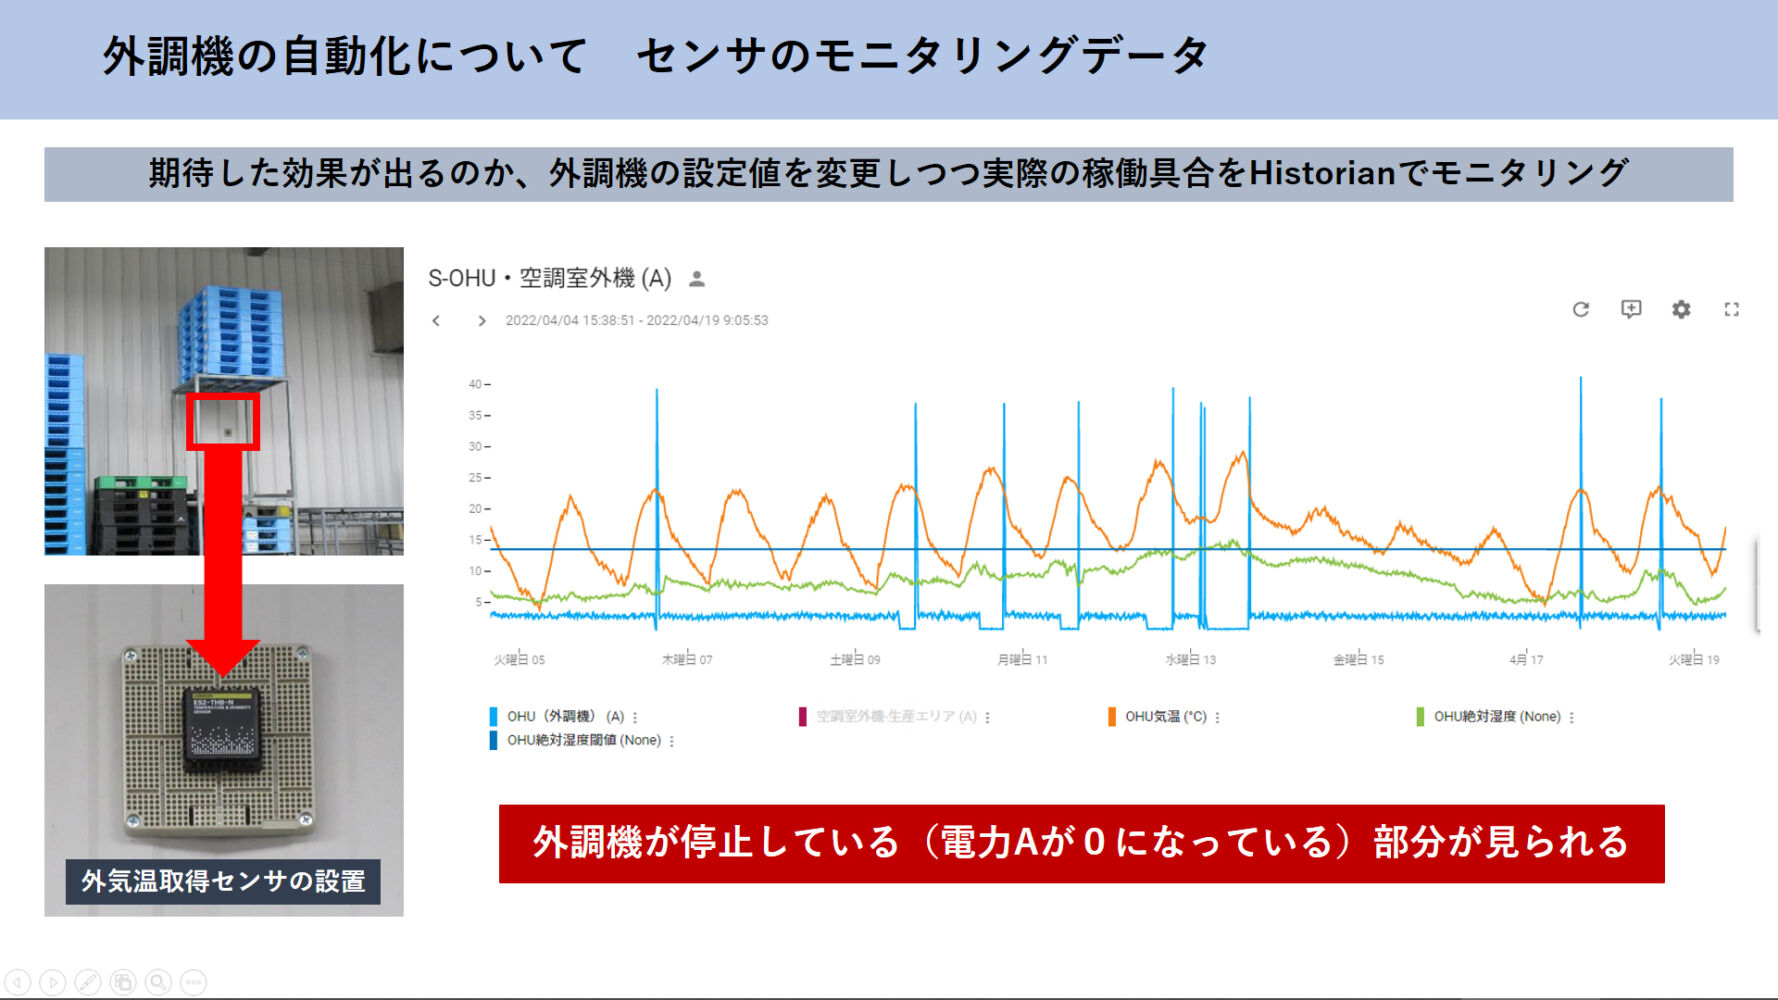
The molding plant is air-conditioned to a temperature of 23°C. The temperature is controlled by two air conditioning systems: an outside air conditioner that draws in outside air (through several layers of filters) and an inside air conditioner that changes the temperature in the molding factory. The outdoor air conditioner has only simple operations for seasonal changes in summer and winter, and there is no mechanism to match the outside temperature. If the incoming outdoor air is hot, the inside of the factory that takes in that outdoor air will also be hot, so the air conditioner is turned up high. The same is true when it is cold.
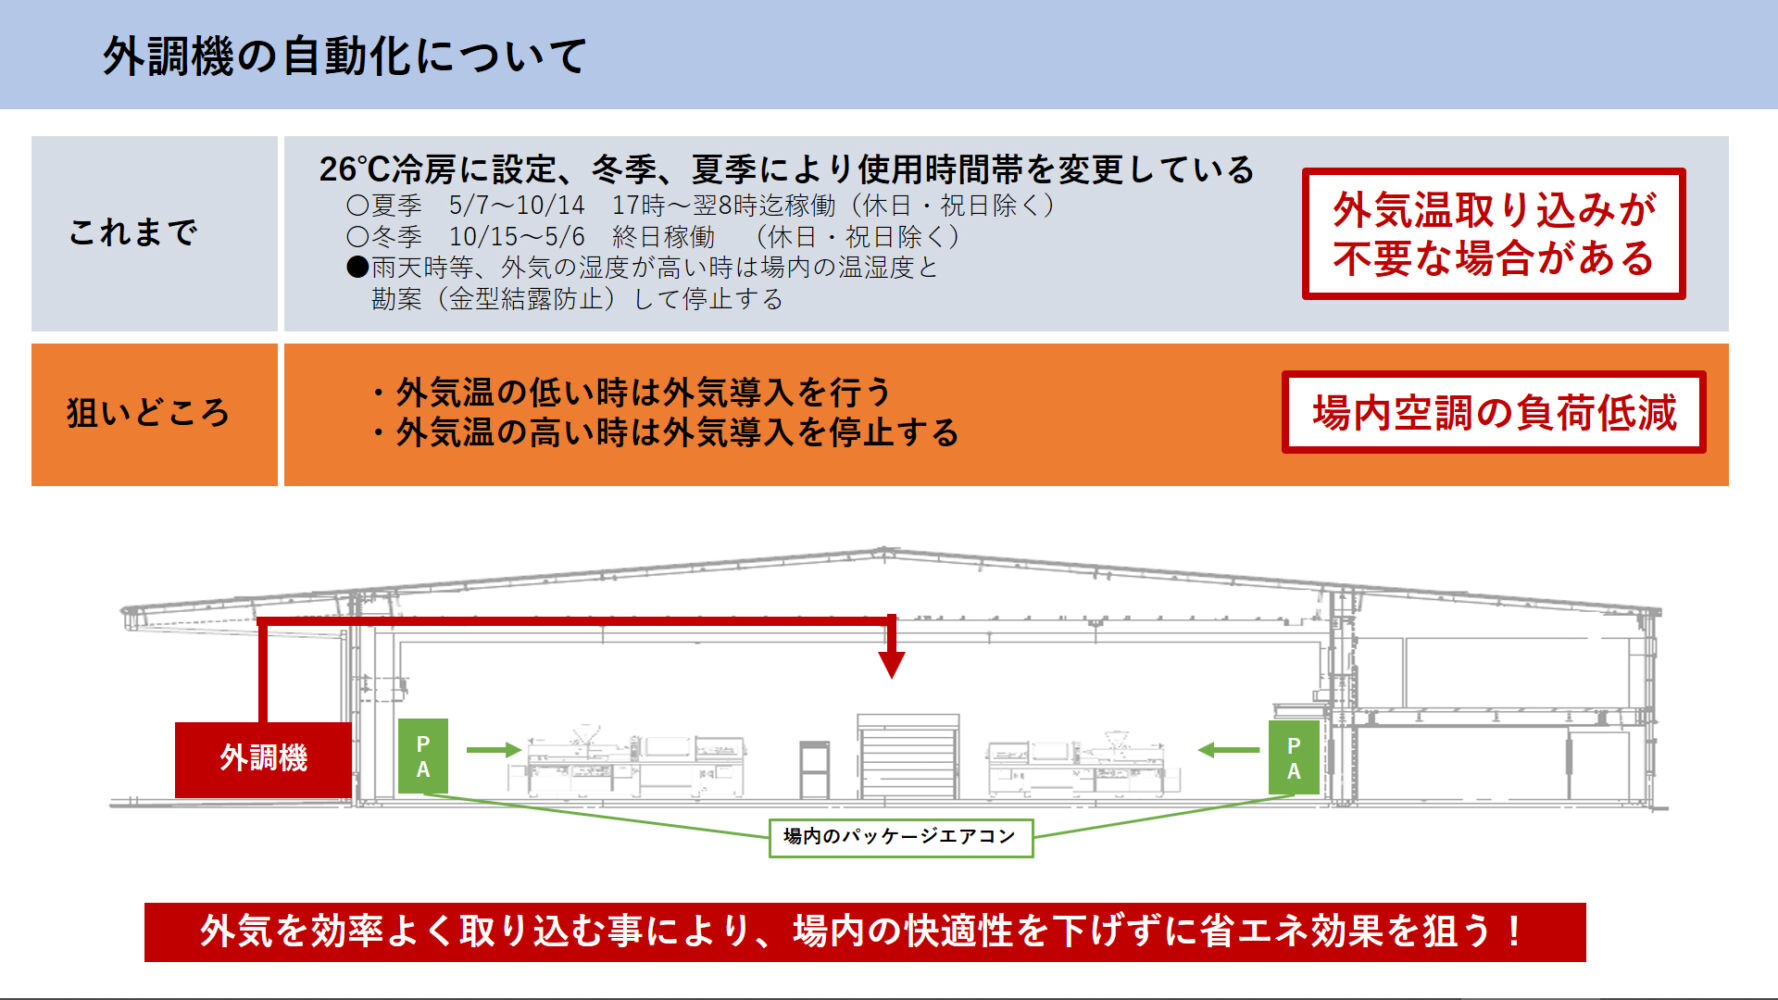
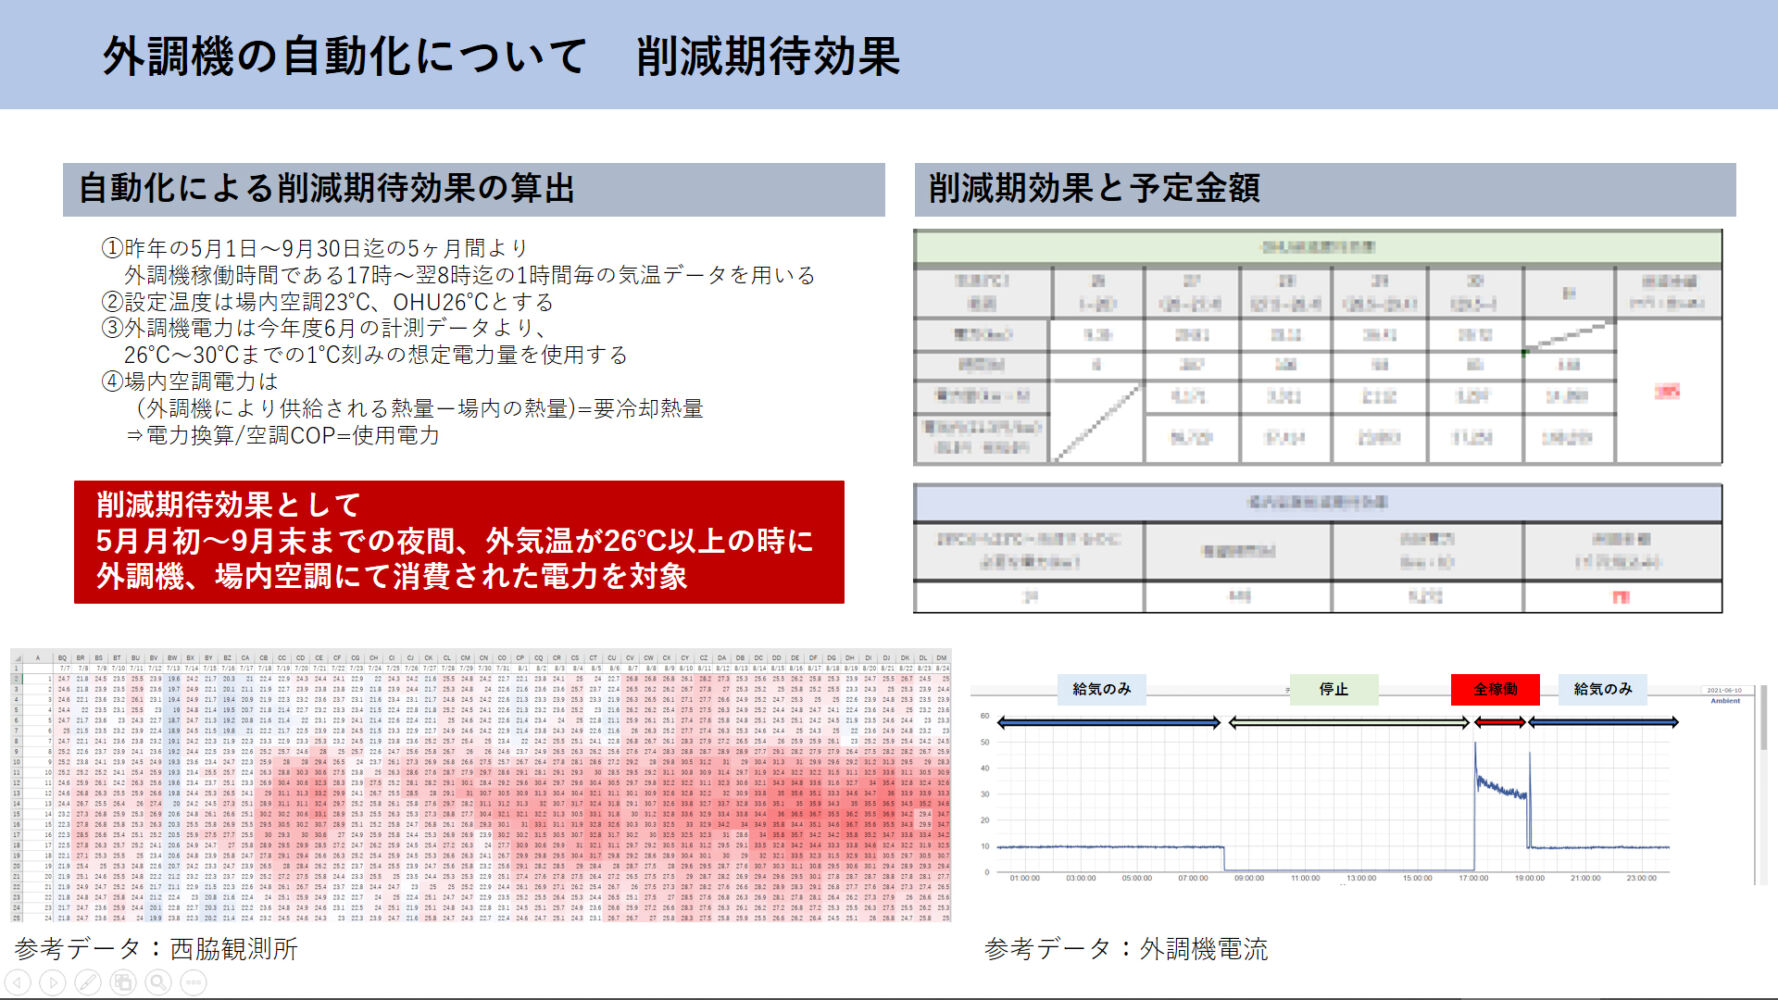
We wanted to automate the operation of the external air conditioner, thinking that we could reduce the power consumption of the air conditioner by stopping the unnecessary intake of outside air when the outside air is higher or lower than the standard value. However, we did not have information on the actual temperature at which the outdoor controller should be automatically turned on or off, or how much the output of the outdoor controller should be, etc. We conducted tests to find a condition in which the controller could operate efficiently. We entered information into Historian, such as the outside temperature, the power consumption of the air conditioner, and the output of the outside air conditioner and changed the settings to see how it would perform. Based on the data, we could determine the most efficient way to operate the air conditioner. We can know the effect after the summer of 2022.
②Workload of inspectors
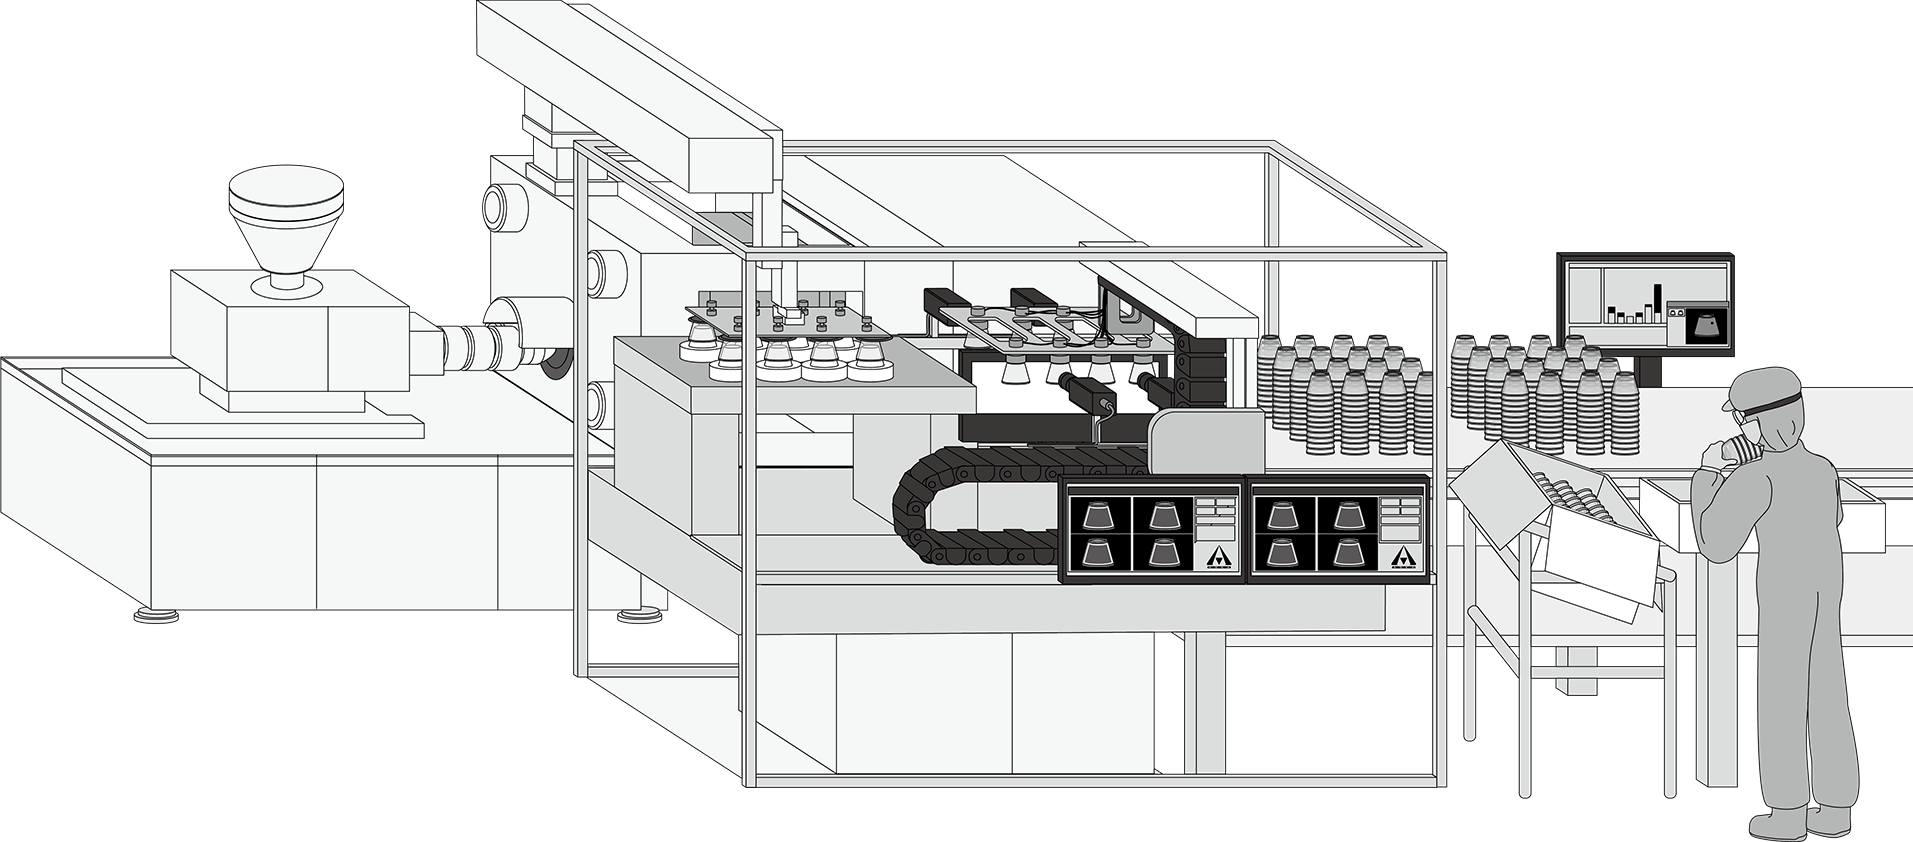
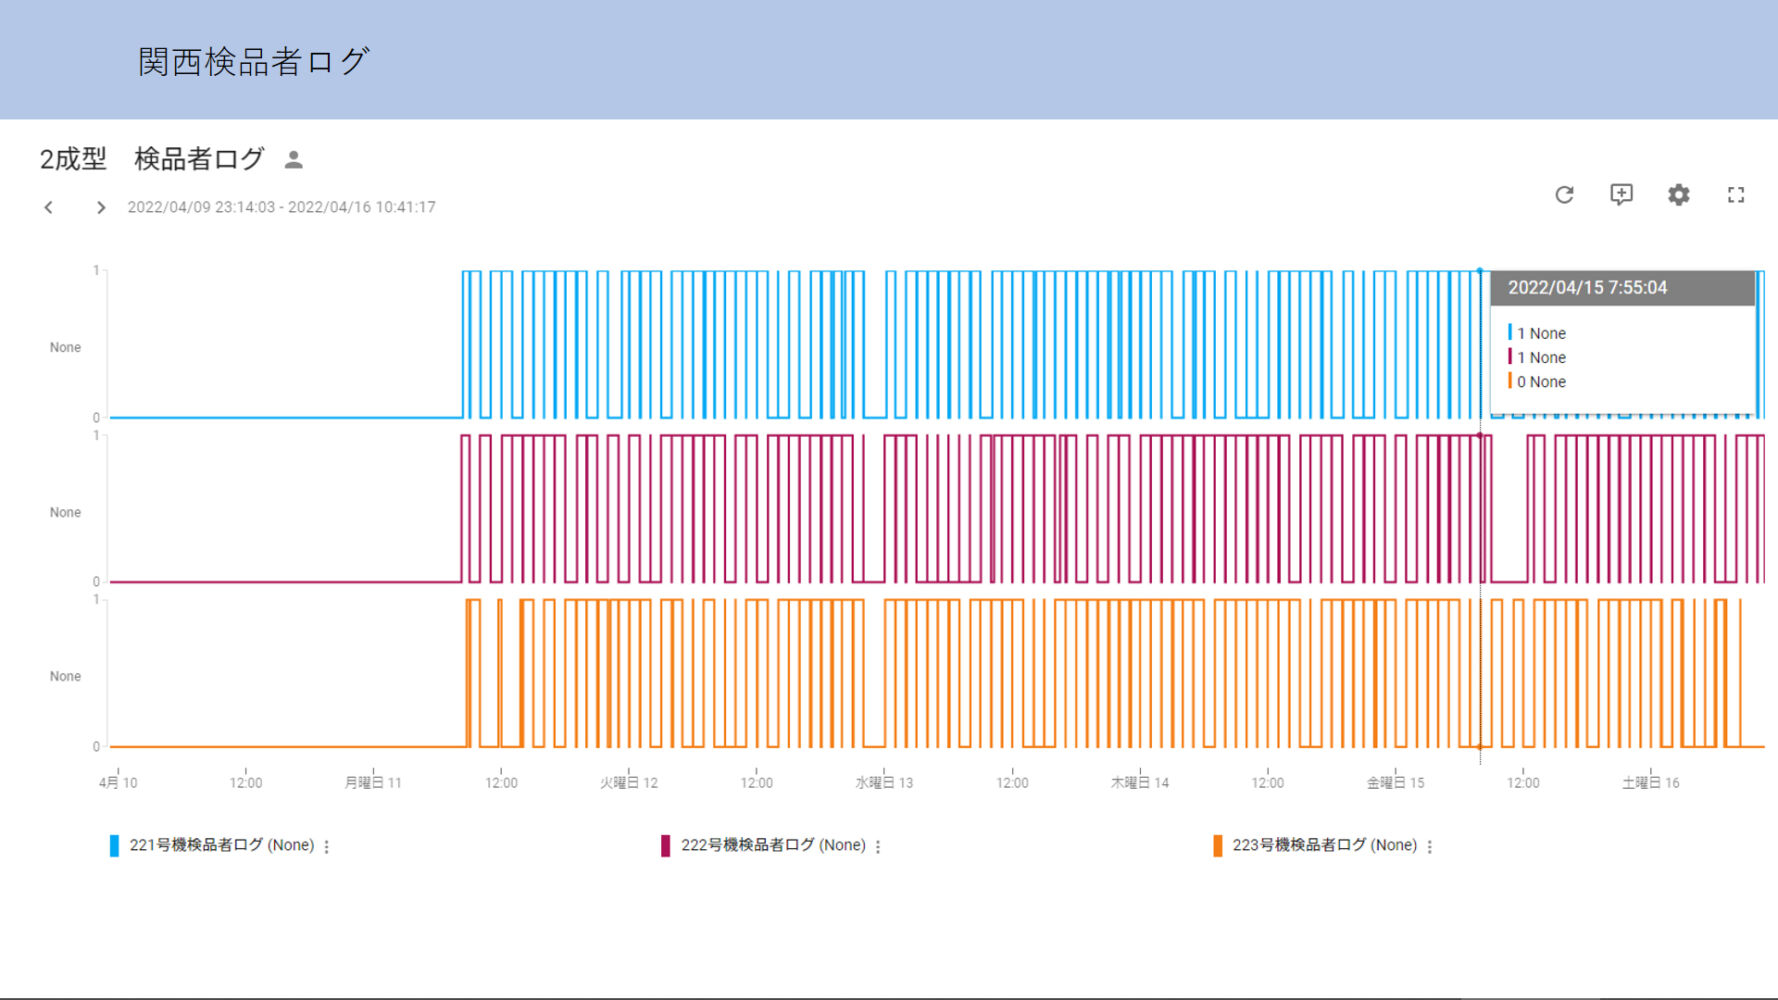
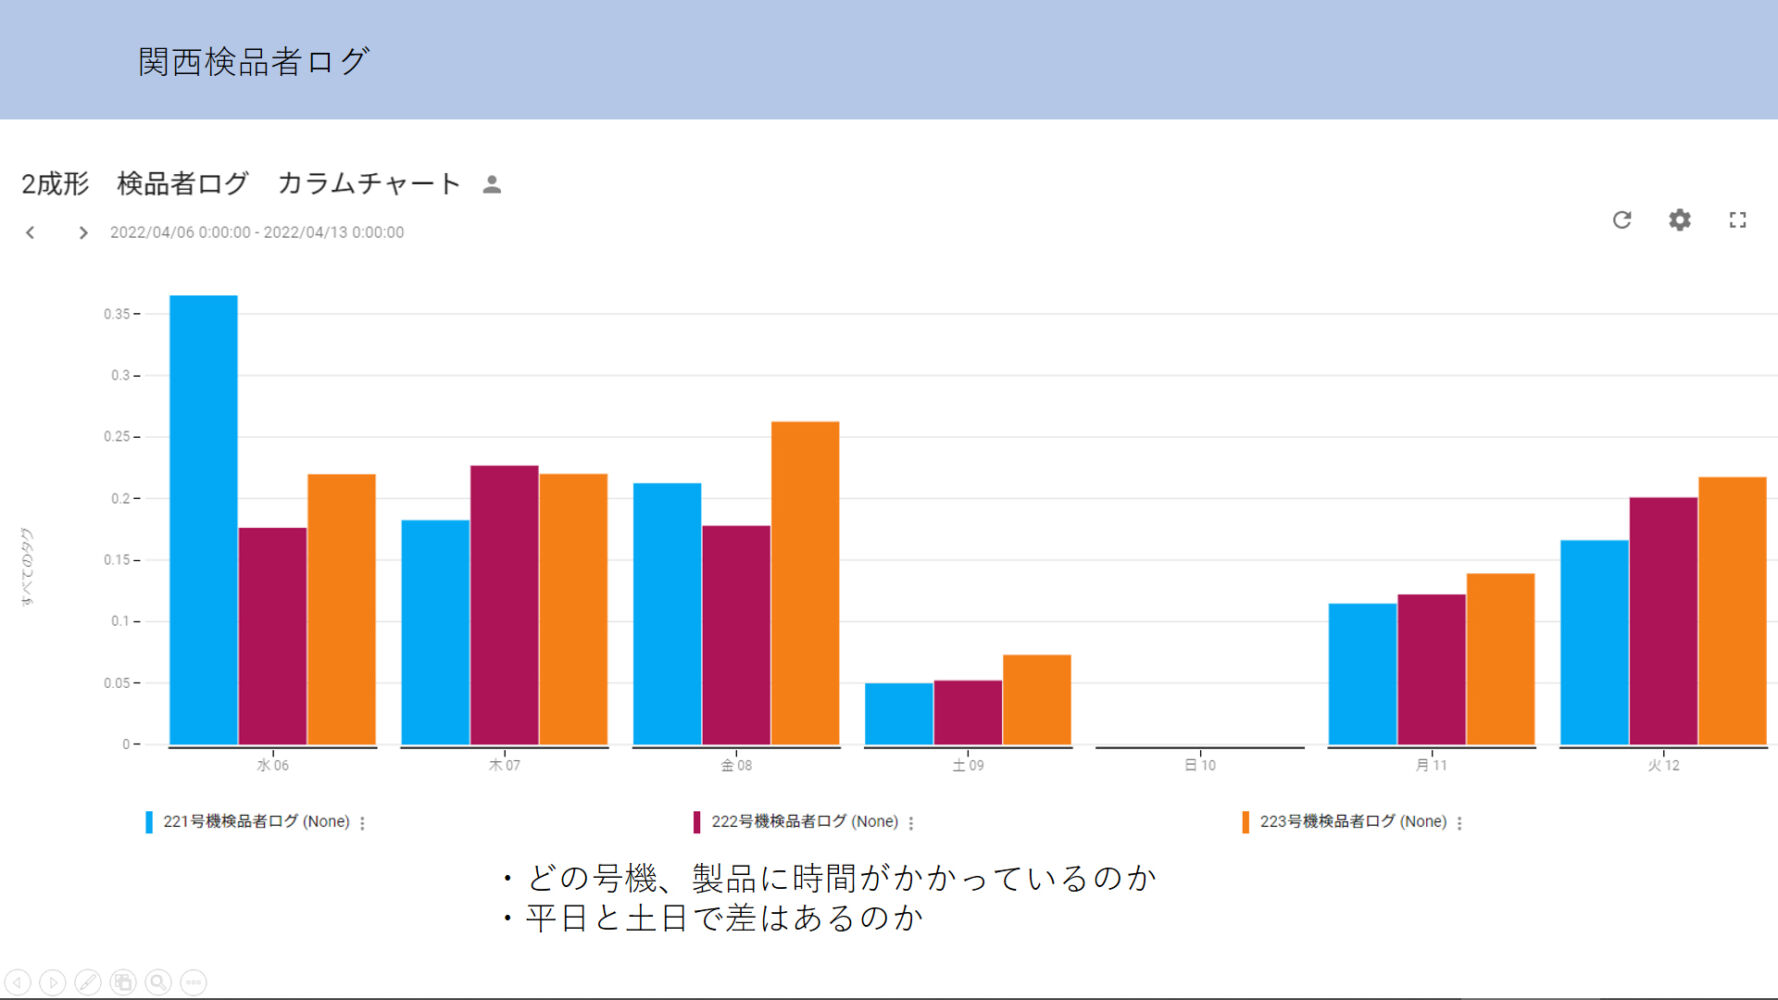
In the Kansai Plant's 2-molding production area, there is a line where products are stacked, and inspectors check and pack into boxes due to the nature of the products. We investigated the timing of the start of work, the continuous inspection time, and whether the inspection time varies with each unit or product.
Although we can't put this data to actual use until later, we believe that the understanding of overcrowding in various tasks can be useful for other tasks.
At Aska Company, we actively use data in various departments and many ways. In addition to familiarity with data utilization, we search for ways to utilize data and educate on how to use it. Company-wide IoT utilization is one of our strengths and a source of our evolution.