We introduced the article"Easily Analyze Various Sensing Data" in the July 2022 issue of Market News.
In this issue of Market News, as a sequel, we would like to introduce examples of Aska Company's utilization of sensing data.
First of all, we proceeded step by step, considering the following three steps for the utilization of sensing data.
"Three Levels of IoT" for Utilization of Sensing Data
Level.1『Monitoring』
Visualization of data on the status of facilities, people, and goods
Level.2『Optimization』
Energy-saving operation and determination of abnormal conditions by integrating products, equipment, and applications
Level.3『Maintenance』
Areas that can be addressed without constant human supervision
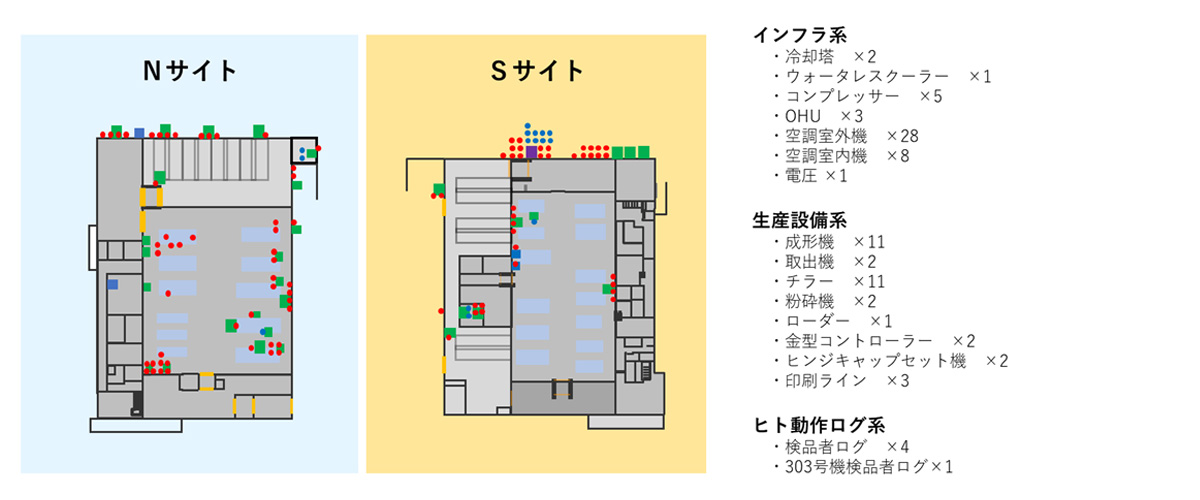
We use various sensors to sense and visualize data on infrastructure systems, production equipment, human movement, temperature, and humidity (environmental systems) for monitoring.

86設備・12地点のデータをモニタリングしている
Level.1 Example from Monitoring
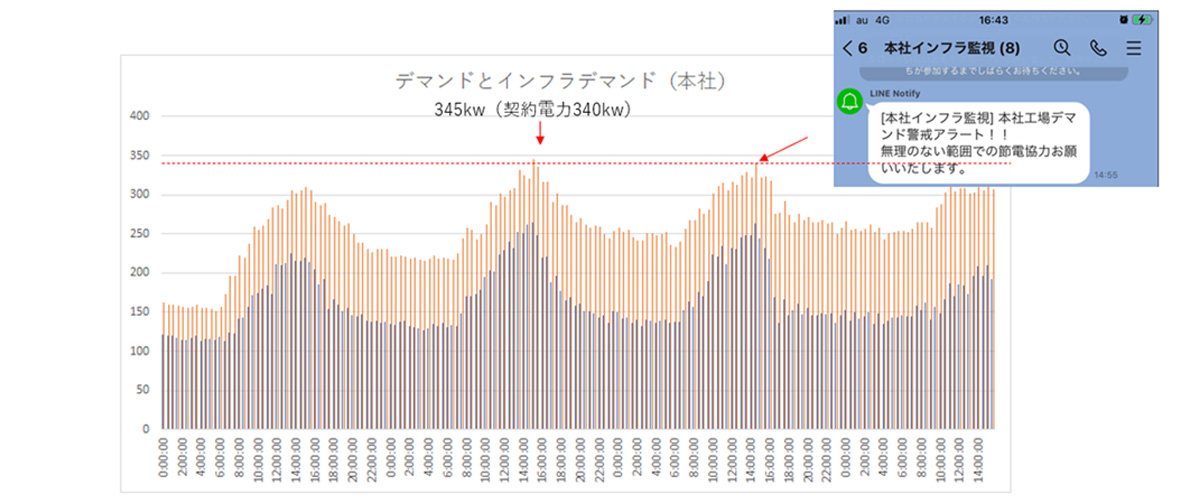
Main Plant: Demand Alarm
The following case is an example of consolidating power data from infrastructure facilities, monitoring the power values at all times, and linking them to LINE notifications.
By notifying relevant parties in the event of an abnormality, we suppressed the demand value and reduced the electricity costs.

Monitoring Contents
Since we didn't monitor the demand, we made it possible to monitor the power data of infrastructure facilities together.
Result
When demand values are about to be exceeded, a line is sent to the relevant parties, and we can deal with the situation.
We prevented an increase in contracted electricity (400,000-500,000 per year).
Level.2 Example from Optimization
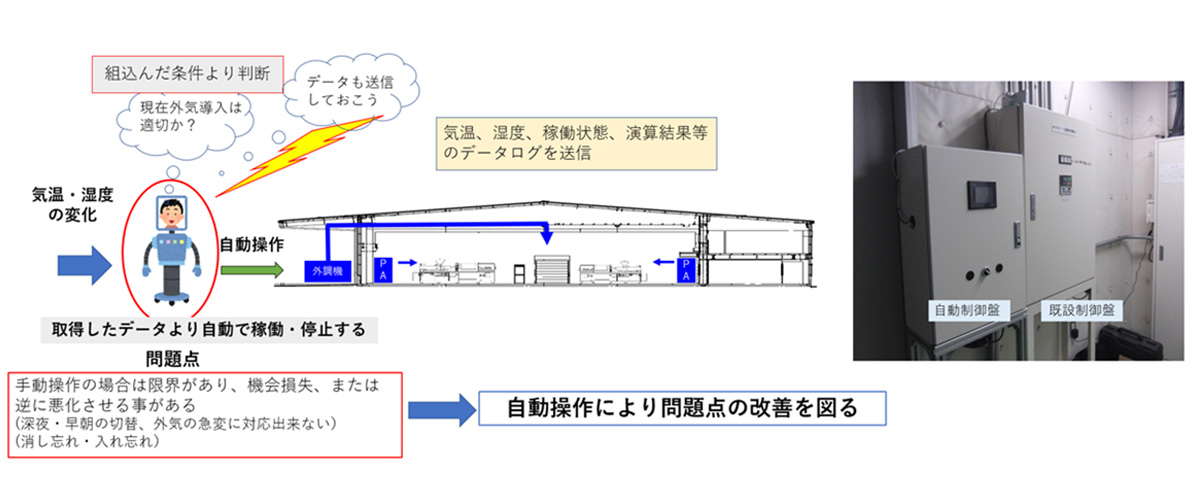
Main Plant: OHU Automation

ProblemThe Manual operation has limitations and may result in lost opportunities or worsen the situation. (Cannot respond to switching late at night, early in the morning, or to sudden changes in outside air quality. (Losses due to forgetting to turn off or turn on) |
→ |
Improvement PlanAutomated operation improves problem areas. |
Details of Appropriation
The OHU, which had previously been manually operated, is now automatically turned on and off by the OHU in response to changes in temperature and humidity.
Result
The OHU is turned ON/OFF according to the outside air temperature, contributing to power reduction.
Effect: 21,200kwh Annual: 424,000 yen
【Level.3 Example from Maintenance】
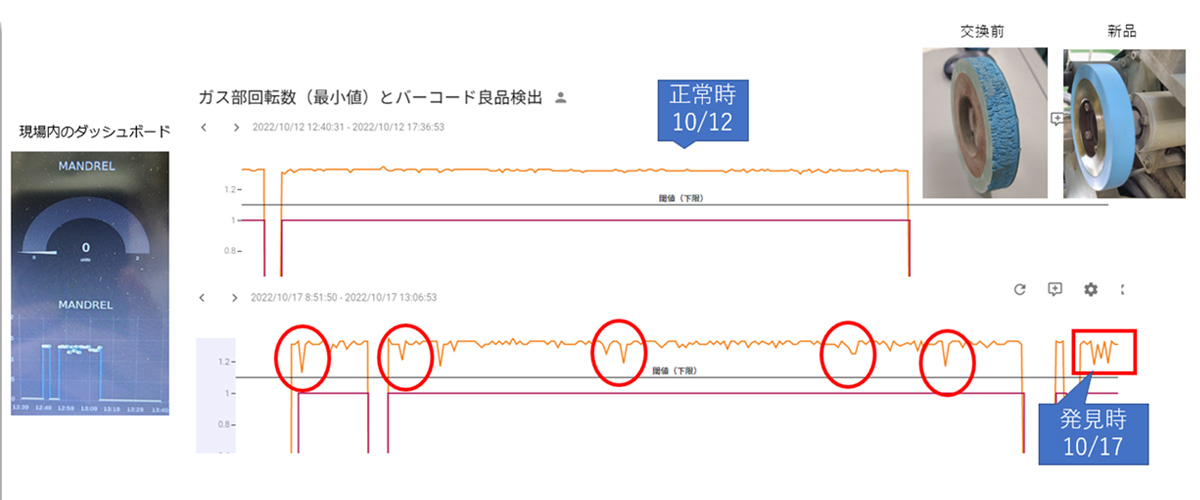
Predictive maintenance of mandrel auxiliary rotating roller abnormalities

状況
We can check the status of mandrel rotation at any time on the dashboard in the plant.
Result
We can replace rotating rollers when necessary → Reduction of unnecessary replacements.
We can check the data to determine whether past conditions were normal. → Identification of the scope (reduction of unnecessary discards) and reduction of retroactive inspections.
Aska company has been working to improve quality by analyzing molding machine data, performing proactive maintenance, and visualizing data from camera inspection equipment.
Based on these activities, we are currently implementing resource-saving measures. We will continue our manufacturing activities in consideration of the environment.
We have briefly introduced some of our cases, but if you are interested in this article, please feel free to ask us.
Paid seminars to observe IoT and AI applications
IoT and AI Application Seminar / Nighttime Unmanned Factory Seminar / DX Top Seminar